
An essential part of running and administering an Ubuntu system involves monitoring the overall system health regarding memory, swap, storage, and processor usage. This includes knowing how to inspect and manage the system and user processes running in the background. This chapter will outline some tools and utilities that can be used to monitor system resources and processes on an Ubuntu system.
Managing Processes
Even when an Ubuntu system appears idle, many system processes will run silently in the background to keep the operating system functioning. For example, when you execute a command or launch an app, user processes are started, running until the associated task is completed.
To obtain a list of active user processes you are currently running within the context of a single terminal or command-prompt session, use the ps command as follows:
$ ps
  PID TTY          TIME CMD
10395 pts/1    00:00:00 bash
13218 pts/1    00:00:00 psCode language: plaintext (plaintext)
The output from the ps command shows that two user processes are running within the context of the current terminal window or command prompt session, the bash shell into which the command was entered, and the ps command itself.
To list all active processes running for the current user, use the ps command with the -a flag. This command will list all running processes that are associated with the user regardless of where they are running (for example, processes running in other terminal windows):
 |
You are reading a sample chapter from Ubuntu 22.04 Essentials. Buy the full book now in eBook ($24.99) format. Includes 36 chapters. Learn more. |
$ ps -a
    PID TTY          TIME CMD
   5442 tty2     00:00:00 gnome-session-b
   6350 pts/0    00:00:00 sudo
   6354 pts/0    00:00:00 su
   6355 pts/0    00:00:00 bash
   9849 pts/2    00:00:00 nano
   9850 pts/1    00:00:00 psCode language: plaintext (plaintext)
As shown in the above output, the user is running processes related to the GNOME desktop, the shell session, the nano text editor, and the ps command.
To list the processes for a specific user, run ps with the -u flag followed by the user name:
# ps -u john
  PID TTY          TIME CMD
  914 ?        00:00:00 systemd
  915 ?        00:00:00 (sd-pam)
  970 ?        00:00:00 gnome-keyring-d
  974 tty1     00:00:00 gdm-x-session
.
.Code language: plaintext (plaintext)
Note that each process is assigned a unique process ID which can be used to stop the process by sending it a termination (TERM) signal via the kill command. For example:
$ kill 13217Code language: plaintext (plaintext)The advantage of ending a process with the TERM signal is that it allows the process to exit gracefully, potentially saving any data that might otherwise be lost.
If the standard termination signal does not terminate the process, repeat the kill command with the -9 option. This command sends a KILL signal which should cause even frozen processes to exit but does not give the process a chance to exit gracefully, possibly resulting in data loss:
|
You are reading a sample chapter from Ubuntu 22.04 Essentials. Buy the full book now in eBook ($24.99) format. Includes 36 chapters. Learn more. |
$ kill -9 13217Code language: plaintext (plaintext)To list all of the processes running on a system (including all user and system processes), execute the following command:
$ ps -ax
    PID TTY      STAT   TIME COMMAND
      1 ?        Ss     0:22 /usr/lib/systemd/systemd rhgb --switched-root
      2 ?        S      0:00 [kthreadd]
      3 ?        I<     0:00 [rcu_gp]
      4 ?        I<     0:00 [rcu_par_gp]
      5 ?        I<     0:00 [netns]Code language: plaintext (plaintext)
To list all processes and include information about process ownership, CPU, and memory use, execute the ps command with the -aux option:
$ ps -aux
USER         PID %CPU %MEM    VSZ   RSS TTY      STAT START   TIME COMMAND
root           2  0.0  0.0      0     0 ?        S    09:59   0:00 [kthreadd]
root           3  0.0  0.0      0     0 ?        I<   09:59   0:00 [rcu_gp]
root           4  0.0  0.0      0     0 ?        I<   09:59   0:00 [rcu_par_gp]
root           5  0.0  0.0      0     0 ?        I<   09:59   0:00 [netns]
root           7  0.0  0.0      0     0 ?        I<   09:59   0:00 [kworker/0:0H-events_highpri]
root           9  0.0  0.0      0     0 ?        I<   09:59   0:00 [kworker/0:1H-events_highpri]
.
.
demo        9788  0.1  1.4 763248 50480 ?        Ssl  15:05   0:00 /usr/libexec/gnome-terminal-serv
demo        9814  0.0  0.1 224108  5664 pts/2    Ss   15:05   0:00 bash
demo        9849  0.0  0.0 222412  3588 pts/2    S+   15:06   0:00 nano
demo        9873  0.0  0.1 233416  6280 pts/1    R+   15:08   0:00 ps -auxCode language: plaintext (plaintext)
A Linux process can start its own sub-processes (referred to as spawning), resulting in a hierarchical parent-child relationship between processes. To view the process tree, use the ps command and include the -H option. Below is part of the tree output for a ps -aH command execution:
$ ps -aH
PID TTY TIME CMD
10036 pts/3 00:00:00 ps
6350 pts/0 00:00:00 sudo
6354 pts/0 00:00:00 su
6355 pts/0 00:00:00 bash
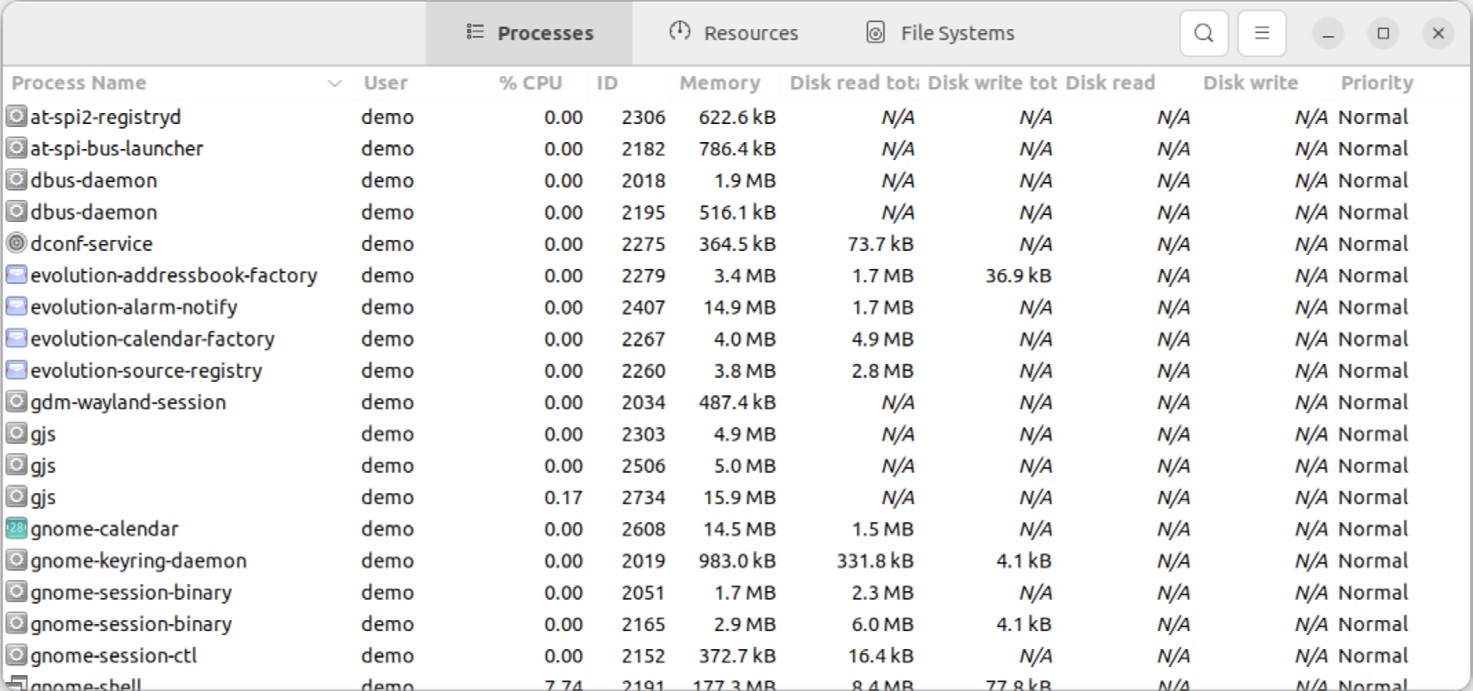
5442 tty2 00:00:00 gnome-session-bCode language: plaintext (plaintext)Process information may also be viewed via the System Monitor tool from the GNOME desktop. This tool can either be launched by searching for “System Monitor” within the desktop environment or from the command line as follows:
$ gnome-system-monitorCode language: plaintext (plaintext)Once the System Monitor has launched, select the Processes button located in the toolbar to list the processes running on the system, as shown in Figure 37-1 below:
|
You are reading a sample chapter from Ubuntu 22.04 Essentials. Buy the full book now in eBook ($24.99) format. Includes 36 chapters. Learn more. |
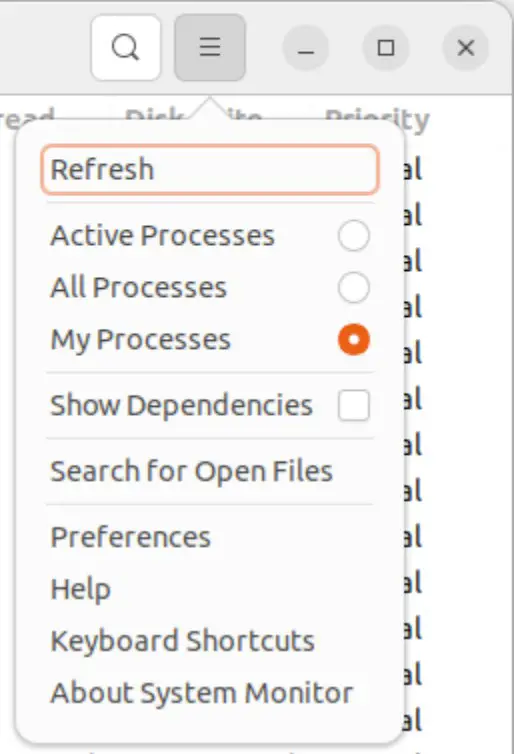
To change the processes listed (for example, to list all processes or just your own processes), use the menu as illustrated in Figure 37-2:
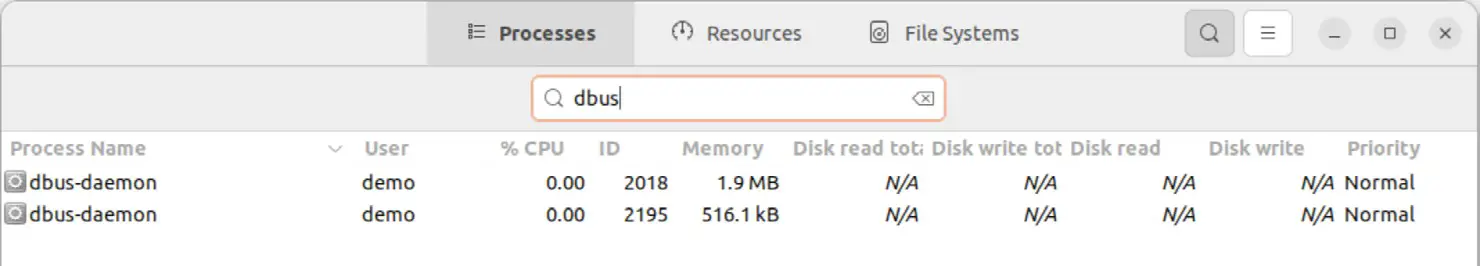
To filter the list of processes, click on the search button in the title bar and enter the process name into the search field:
To display additional information about a specific process, select it from the list and click on the button located in the bottom right-hand corner (marked A in Figure 37-4) of the dialog:
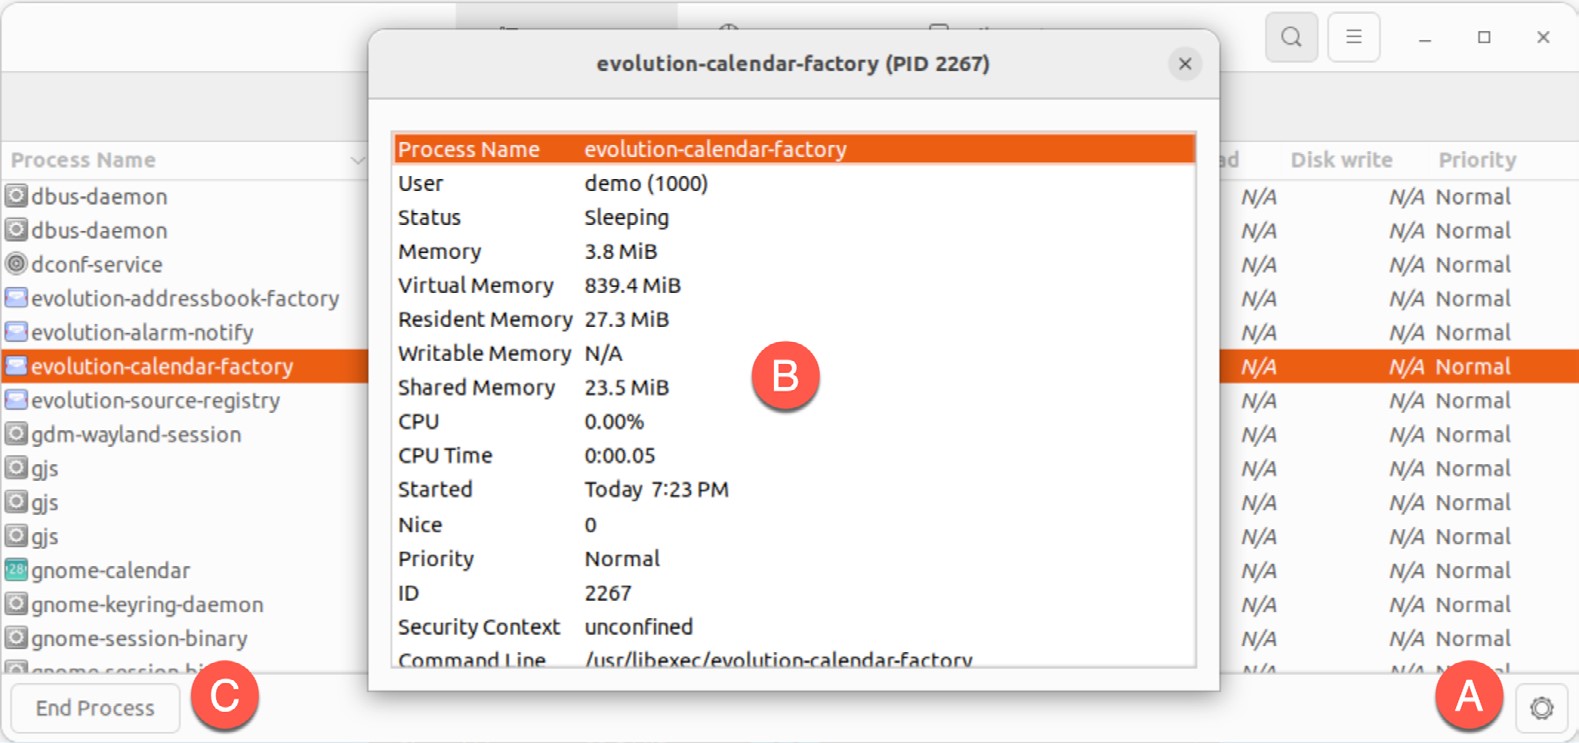
A dialog similar to that marked B in the above figure will appear when the button is clicked. Select a process from the list and click the End Process button (C) to terminate it.
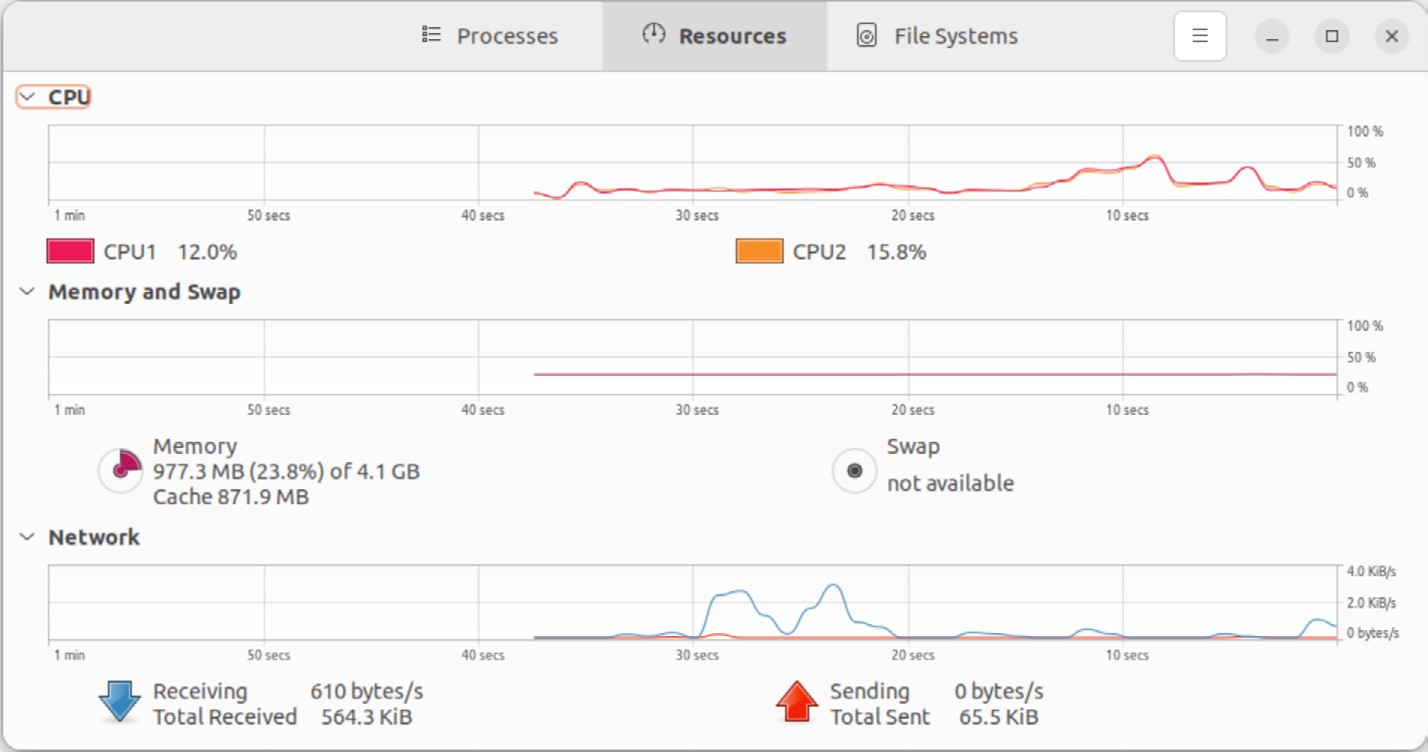
To monitor CPU, memory, swap, and network usage, click on the Resources button in the title bar to display the screen shown in Figure 37-5:
|
You are reading a sample chapter from Ubuntu 22.04 Essentials. Buy the full book now in eBook ($24.99) format. Includes 36 chapters. Learn more. |
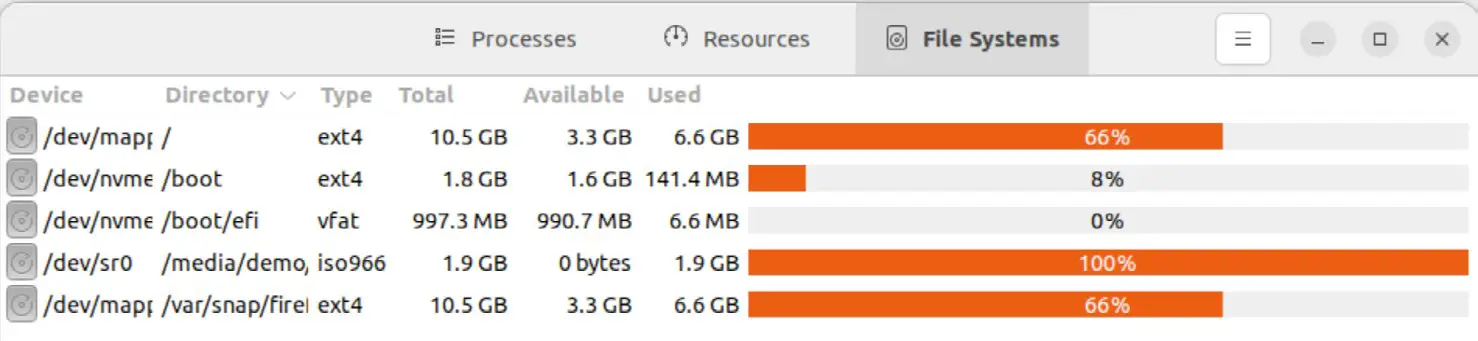
Similarly, a summary of storage space used on the system can be viewed by selecting the File Systems toolbar button:
Real-time System Monitoring with top
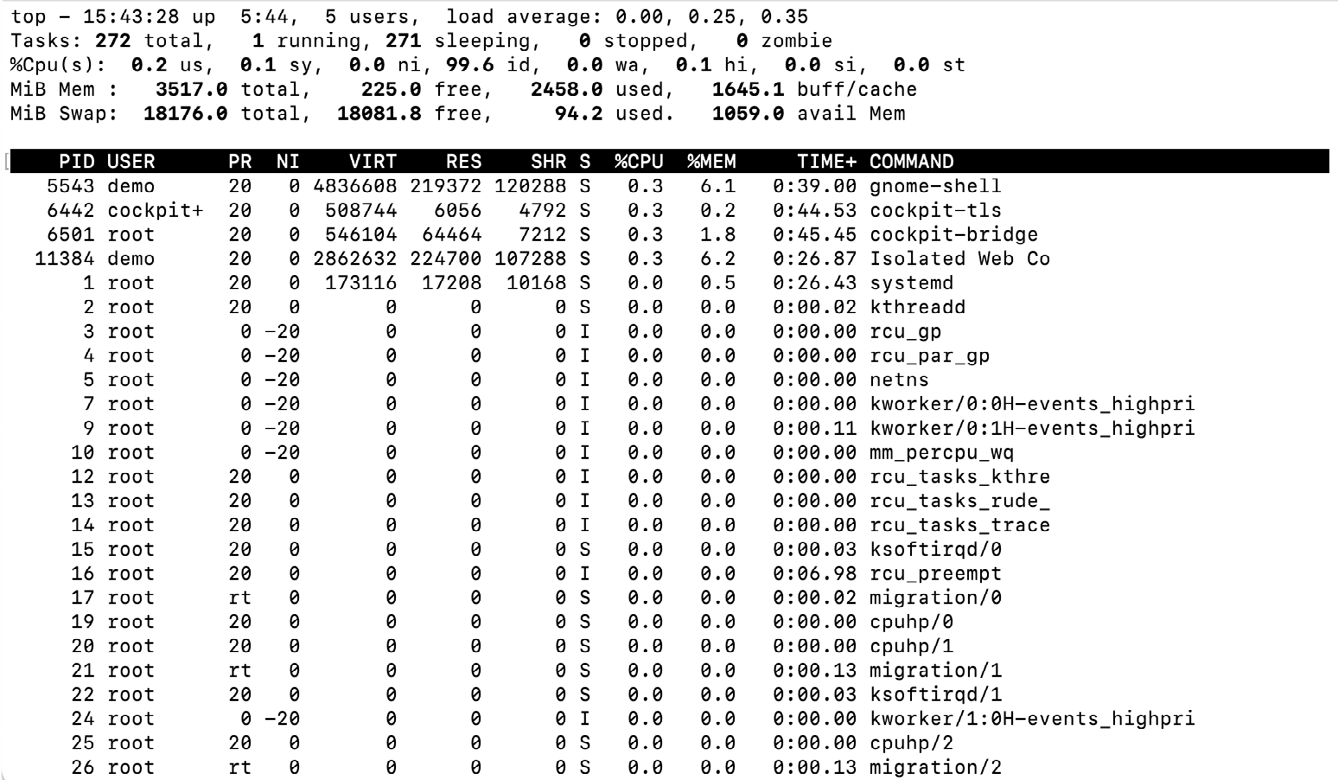
As the chapter “An Overview of the Cockpit Web Interface” outlined, the Cockpit web interface can perform basic system monitoring. The previous section also explained how the GNOME System Monitor tool could be used to monitor processes and system resources. This chapter also explored how the ps command can provide a snapshot of the processes running on an Ubuntu system. However, the ps command does not provide a real-time view of the processes and resource usage on the system. The top command is an ideal tool for real-time monitoring of system resources and processes from the command prompt.
When running, top will list the processes running on the system ranked by system resource usage (with the most demanding process in the top position). The upper section of the screen displays memory and swap usage information together with CPU data for all CPU cores. All of this output is constantly updated, allowing the system to be monitored in real-time:
To limit the information displayed to the processes belonging to a specific user, start top with the -u option followed by the user name:
$ top -u johnCode language: plaintext (plaintext)For a complete listing of the features available in top, press the keyboard ‘h’ key or refer to the man page:
|
You are reading a sample chapter from Ubuntu 22.04 Essentials. Buy the full book now in eBook ($24.99) format. Includes 36 chapters. Learn more. |
$ man topCode language: plaintext (plaintext)Command-Line Disk and Swap Space Monitoring
Disk space can be monitored from within Cockpit and using the GNOME System Monitor. To identify disk usage from the command line, however, the df command provides a helpful and quick overview:
To review current swap space and memory usage, run the free command:
# free
              total        used        free      shared  buff/cache   available
Mem:        3823720      879916     1561108      226220     1382696     2476300Code language: plaintext (plaintext)
To continuously monitor memory and swap levels, use the free command with the -s option, specifying the delay in seconds between each update (keeping in mind that the top tool may provide a better way to view this data in real-time):
$ free -s 1
Mem: 3823720 879472 1561532 226220 1382716 2476744
Swap: 2097148 0 2097148
total used free shared buff/cache available
Mem: 3823720 879140 1559940 228144 1384640 2475152
Swap: 2097148 0 2097148
.
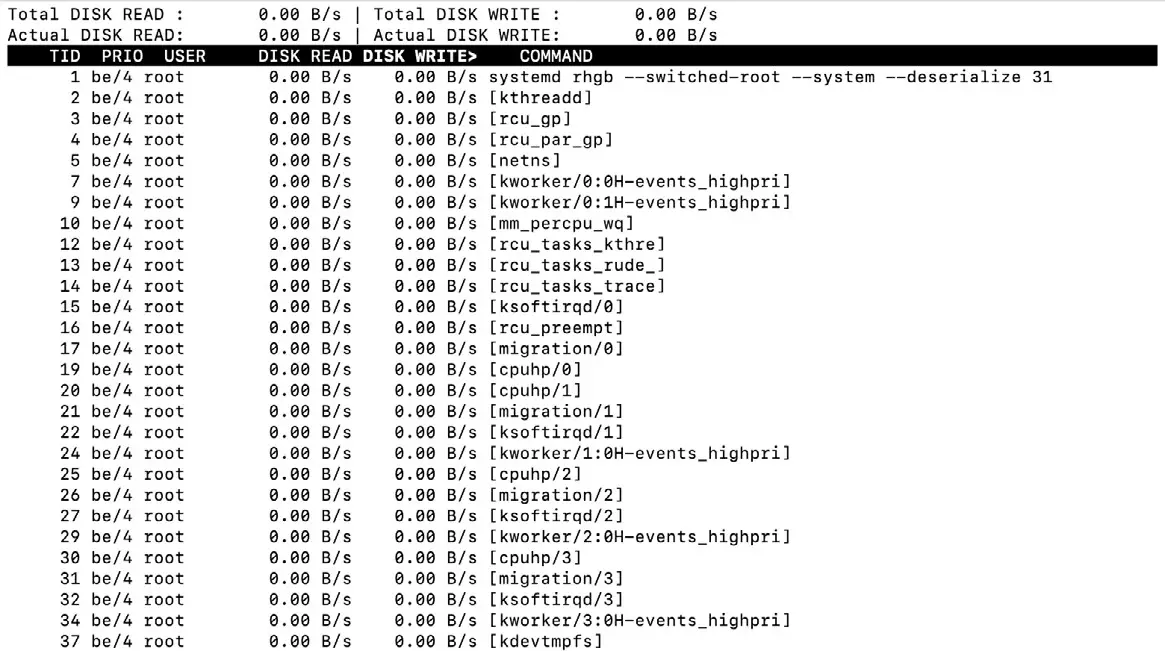
.Code language: plaintext (plaintext)To monitor disk I/O from the command line, consider using the iotop command, which can be installed as follows:
# apt install iotopCode language: plaintext (plaintext)Once installed and executed (iotop must be run with system administrator privileges), the tool will display a real-time list of disk I/O on a per-process basis:
|
You are reading a sample chapter from Ubuntu 22.04 Essentials. Buy the full book now in eBook ($24.99) format. Includes 36 chapters. Learn more. |
Summary
Even a system that appears to be doing nothing will have many system processes running in the background. Activities performed by users on the system will result in additional processes being started. Processes can also spawn their own child processes. Each process will use some system resources, including memory, swap space, processor cycles, disk storage, and network bandwidth. This chapter has explored a set of tools that can be used to monitor both process and system resources on a running system and, when necessary, kill errant processes that may be impacting the performance of a system.