
The objective of this chapter is to demonstrate the main features of the SwiftUI Charts in the form of a tutorial. Topics covered include creating a chart, displaying data from multiple data sources, and use of the style modifier.
The concept behind the tutorial is a chart that displays monthly unit sales containing graphs for both online and retail sales channels.
Creating the ChartDemo Project
Launch Xcode and select the usual options to create a new multiplatform project named ChartDemo.
Adding the Project Data
The first requirement for handling the sales data is to declare a structure to store data for each month. Right-click on the ChartDemo folder in the Project Navigator panel, select the New File… menu option and create a new SwiftUI file named SalesData.swift. Edit the file and add the following struct declaration:
import Foundation

struct SalesInfo: Identifiable {
    var id = UUID()
    var month: String
    var total: Int
}Code language: Swift (swift)
Remaining within the SalesData.swift file, add two arrays containing the retail and online sales data for January through July as follows:
 |
You are reading a sample chapter from an old edition of iOS App Development Essentials. Purchase the fully updated iOS 18 App Development Essentials book. The full book contains 71 chapters, over 612 pages of in-depth information, downloadable source code, and access to over 50 SwiftUI knowledge test quizzes. |
.
.
var retailSales: [SalesInfo] = [
    .init(month: "Jan", total: 5),
    .init(month: "Feb", total: 7),
    .init(month: "March", total: 6),
    .init(month: "April", total: 5),
    .init(month: "May", total: 6),
    .init(month: "June", total: 3),
    .init(month: "July", total: 6)
]

var onlineSales: [SalesInfo] = [
    .init(month: "Jan", total: 2),
    .init(month: "Feb", total: 4),
    .init(month: "March", total: 5),
    .init(month: "April", total: 2),
    .init(month: "May", total: 4),
    .init(month: "June", total: 1),
    .init(month: "July", total: 4)
]Code language: Swift (swift)
Our next requirement is a third array that combines the data from both sales channels. Each element in this third array will also need to include a label string that can be used later when the time comes to split the data into separate channel graphs. Add this array now within the ContentView.swift file. Now is also a good opportunity to import the Charts framework:
import SwiftUI
import Charts

struct ContentView: View {
    var body: some View {

        let sales = [ (channel: "Retail", data: retailSales),
                        (channel: "Online", data: onlineSales) ]
.
.Code language: Swift (swift)
Adding the Chart View
The chart view is going to need to use nested ForEach loops. The outer loop will iterate through the channel entries in the sales array while the inner loop will iterate through the sales data for each channel. Start by adding the Chart view and the outer loop as follows:
struct ContentView: View {
    var body: some View {

        let sales = [ (channel: "Retail", data: retailSales),
                        (channel: "Online", data: onlineSales) ]

        Chart {
            ForEach(sales, id: \.channel) { channels in

            }
        }
        .frame(height: 250)
        .padding()
   }
}Code language: Swift (swift)
The outer loop passes the set of channels to the inner loop where we can then iterate through the sales data. For each month in the data, the inner ForEach loop will need to add an AreaMark instance configured with the month name and sales total. Modify the Chart view declaration so that it reads as follows:
Chart {
    ForEach(sales, id: \.channel) { channels in
        ForEach(channels.data) { sales in
            AreaMark(
                x: .value("Month", sales.month),
                y: .value("Total", sales.total)
            )
        }
    }
}
.
.Code language: Swift (swift)
Review the chart in the Preview panel where it should appear as shown in Figure 1-1 below:
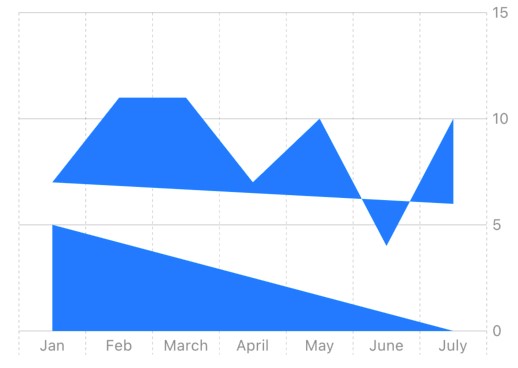
Figure 1-1
|
You are reading a sample chapter from an old edition of iOS App Development Essentials. Purchase the fully updated iOS 18 App Development Essentials book. The full book contains 71 chapters, over 612 pages of in-depth information, downloadable source code, and access to over 50 SwiftUI knowledge test quizzes. |
At this point, the chart is not appearing as intended because we have not taken any steps to separate the online and retail sales data. To divide the data into two graphs we will need to apply the foregroundStyle() modifier to the AreaMark declaration and configure it to filter the data based on the sales channel.
Creating Multiple Graphs
Edit the ContentView.swift file once again, locate the AreaMark instance, and apply the foregroundStyle() modifier:
Chart {
    ForEach(sales, id: \.channel) { channels in
        ForEach(channels.data) { sales in
            AreaMark(
                x: .value("Month", sales.month),
                y: .value("Total", sales.total)
            )
            .foregroundStyle(by: .value("Channel", channels.channel))
        }
    }
}Code language: Swift (swift)
Preview the chart once again and confirm that it now appears correctly as shown in Figure 1-2:
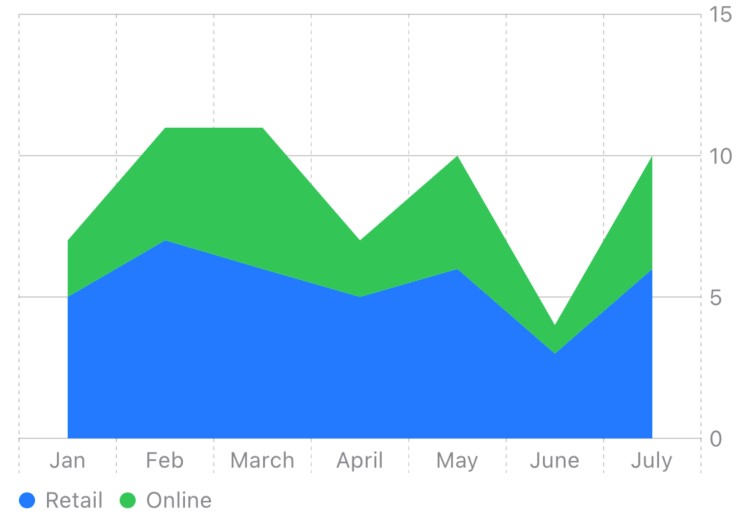
Figure 1-2
Now that the project is complete, take some time to experiment with the chart by adding symbols and using different mark types and interpolation methods. Figure 1-3, for example, shows the effect of replacing AreaMark with PointMark:
|
You are reading a sample chapter from an old edition of iOS App Development Essentials. Purchase the fully updated iOS 18 App Development Essentials book. The full book contains 71 chapters, over 612 pages of in-depth information, downloadable source code, and access to over 50 SwiftUI knowledge test quizzes. |
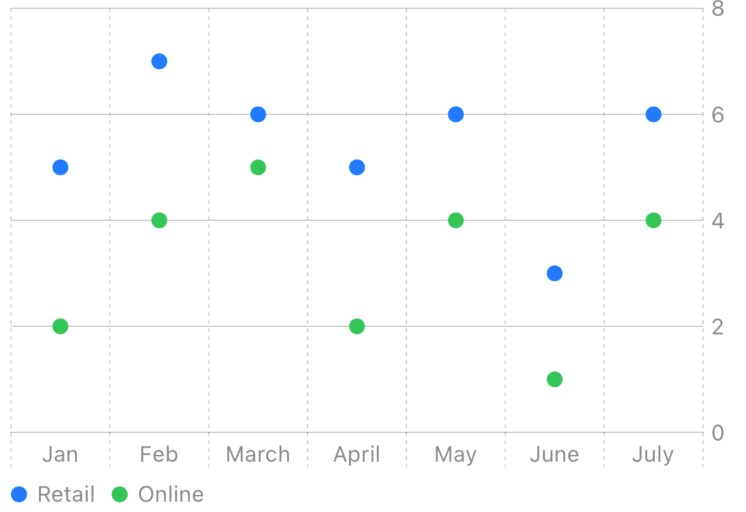
Figure 1-3
Summary
In this chapter, we have created a project that uses SwiftUI Charts to visualize two sets of data in the form of area graphs. Steps covered in the tutorial included the use of the Chart and AreaMark components and the use of the foreground style modifier.